VBA Debugger
In this section, I discuss the details of using the VBA debugging tools.
These tools are much more powerful than the techniques I discuss in the previous section.
But along with power comes responsibility. Using the debugging tools takes a bit of setup work.
Setting breakpoints in your code
In earlier sections, I discuss using MsgBox functions in your code to monitor the values of certain variables.
Displaying a message box essentially halts your code in mid-execution, and clicking the OK button resumes execution.
Wouldn’t it be nice if you could halt a routine’s execution, take a look at the value of any of your variables, and then continue execution?
Well, that’s exactly what you can do by setting a breakpoint.
You can set a breakpoint in your VBA code in several ways:
- Move the cursor to the statement at which you want execution to stop; then press
F9. - Click in the gray margin to the left of the statement at which you want execution to stop. This is I used mainly.
- Position the insertion point in the statement at which you want execution to stop. Then use the Debug -> Toggle Breakpoint command.
- Right-click a statement and choose Toggle -> Breakpoint from the shortcut menu.
The results of setting a breakpoint are shown in below figure.
VBE highlights the line to remind you that you set a breakpoint there; it also inserts a large dot in the gray margin.
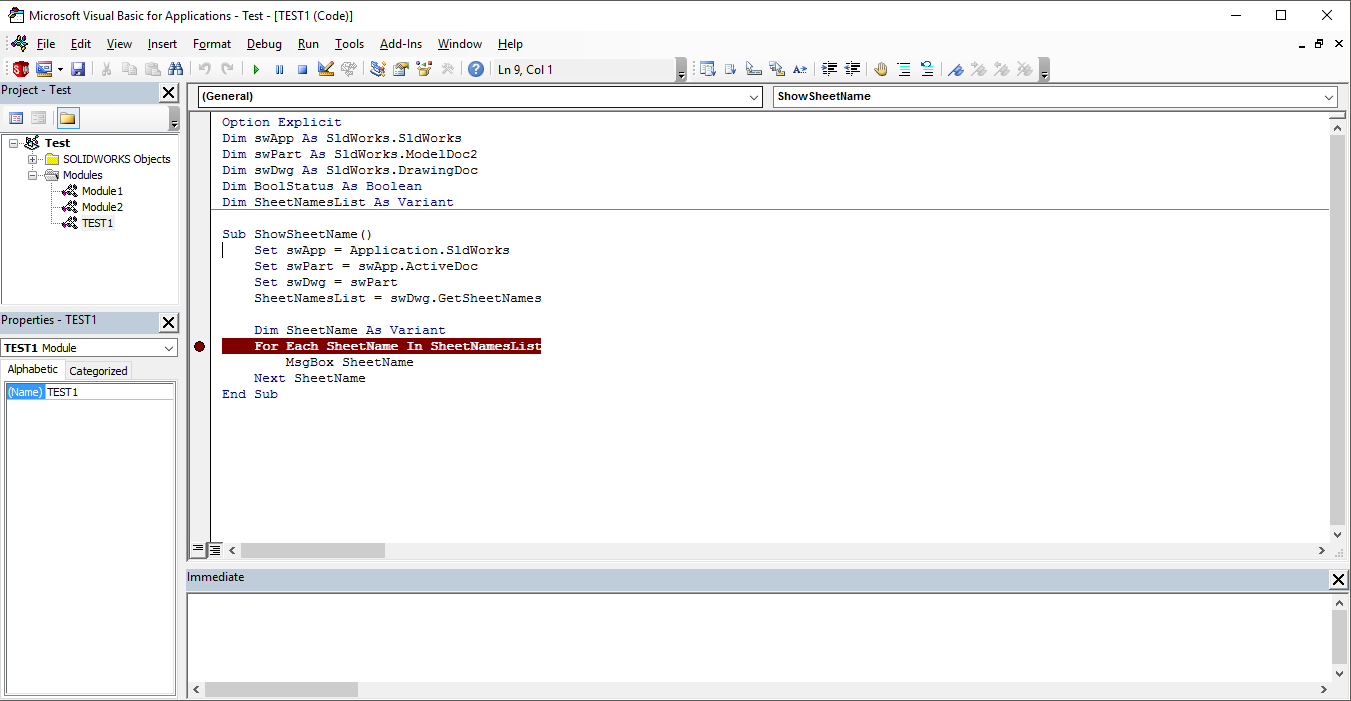
When you execute the procedure, VBE goes into Break mode before the line with the breakpoint is executed.
In Break mode, the word break is displayed in the VBE title bar.
To get out of Break mode and continue execution, press F5 or click the Run Sub/UserForm button in the VBE toolbar.
To quickly remove a breakpoint, click the large dot in the gray margin or move the cursor to the highlighted line and press F9.
To remove all breakpoints in the module, press Ctrl+Shift+F9.
What is Break mode? You can think of it as a state of suspended animation.
Your VBA code stops running and the current statement is highlighted in bright yellow. In Break mode, you can
- Type VBA statements in the Immediate window.
- Press
F8to step through your code one line at a time to check various things while the program is paused. - Move the mouse pointer over a variable to display its value in a small pop-up window.
- Skip the next statement(s) and continue execution there (or even go back a couple of statements).
- Edit a statement and then continue.
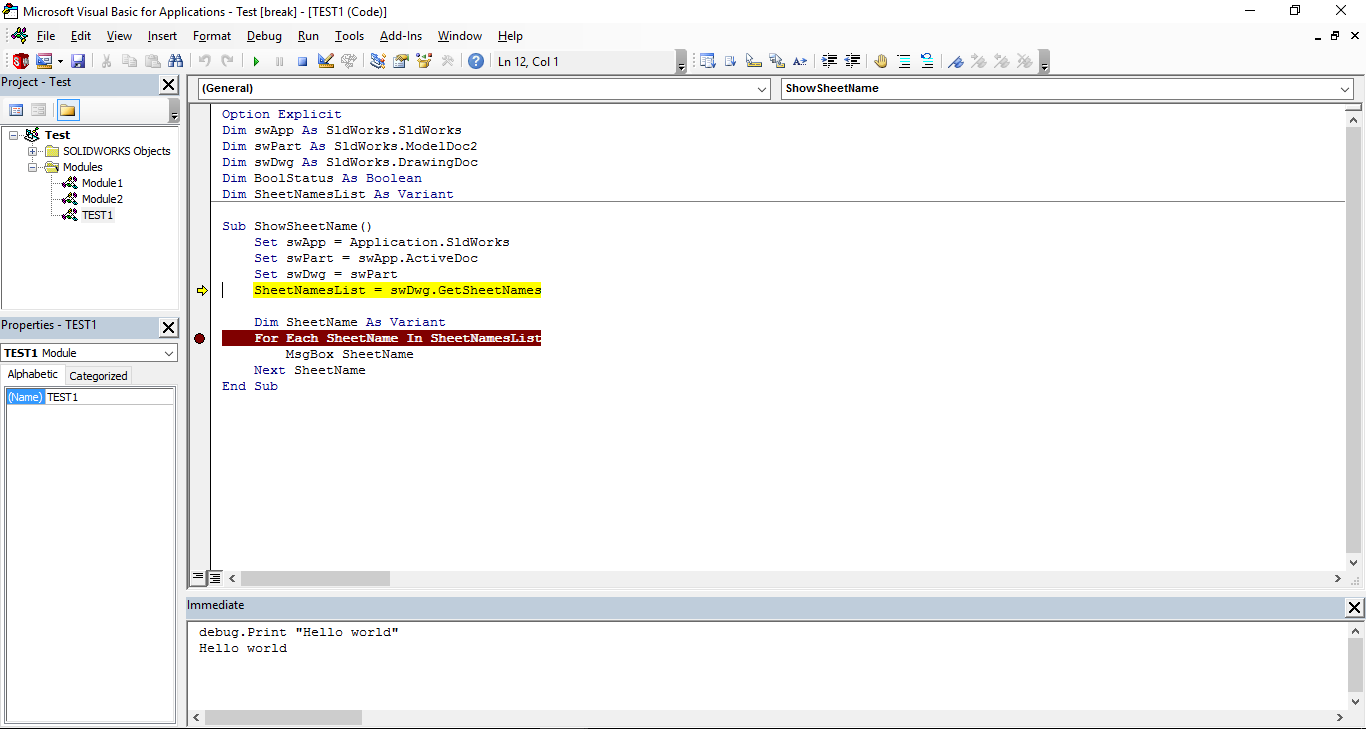
Below figure shows some debugging action.
A breakpoint is set (notice the big dot), and I’m using the F8 key to step through the code line by line (notice the arrow that points to the current statement).
I used the Immediate window to print Hello world.
Using the Immediate window
The Immediate window may not be visible in the VBE.
You can display the VBE’s Immediate window at any time by pressing Ctrl+G.
In Break mode, the Immediate window is particularly useful for finding the current value of any variable in your program.
For example, if you want to know the current value of a variable, enter the following in the Immediate window and press Enter.
The Immediate window lets you do other things besides check variable values.
For example, you can change the value of a variable, try for a new condition.
Just make sure that the command you enter is a valid VBA statement.
Stepping through your code
While in Break mode, you can also step through your code line by line.
One statement is executed each time you press F8.
Throughout this line-by-line execution of your code, you can activate the Immediate window at any time to check the status of your variables.
You can use your mouse to change which statement VBA will execute next.
If you put your mouse pointer in the gray margin to the left of the currently highlighted statement (which will usually be yellow), your pointer changes to a right-pointing arrow.
Simply drag your mouse to the statement you want done next and watch that statement turn yellow.
Using the Watch window
In some cases, you may want to know whether a certain variable or expression takes on a particular value.
For example, suppose that a procedure loops through 1,000 times.
You notice that a problem occurs during the 800th iteration of the loop.
Well, you could insert a breakpoint in the loop, but that would mean responding to 799 prompts before the code finally gets to the iteration you want to see (and that gets boring real fast).
A more efficient solution involves setting a watch expression.
For example, you can create a watch expression that puts the procedure into Break mode whenever a certain variable takes on a specific value — for example, AnyNumber=800.
To create a watch expression, choose Debug -> Add Watch to display the Add Watch dialog box. See below figure.
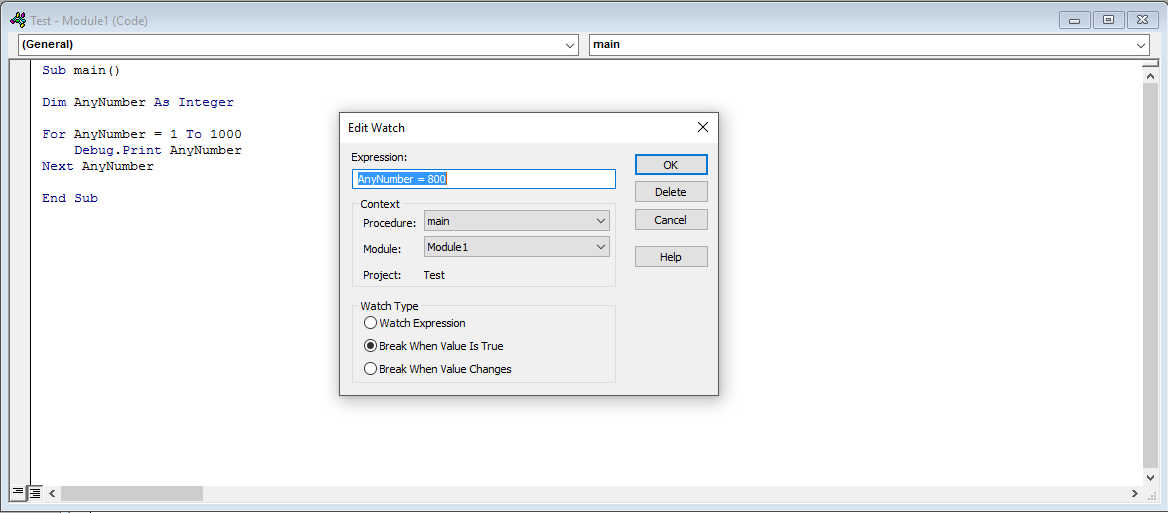
The Add Watch dialog has three parts:
-
Expression: Enter a valid VBA expression or a variable here. For example,
AnyNumber=900or justAnyNumber. -
Context: Select the procedure and the module you want to watch. Note that you can select All Procedures and All Modules.
-
Watch Type: Select the type of watch by clicking an option button. Your choice here depends on the expression you enter. The first choice, Watch Expression, does not cause a break; it simply displays the expression’s value when a break occurs.
Execute your procedure after setting up your watch expression(s).
Things run normally until your watch expression is satisfied (based on the Watch Type you specified).
When that happens, VBE enters Break mode (you did set the Watch Type to “Break When Value Is True,” didn’t you?).
From there, you can step through the code or use the Immediate window to debug your code.
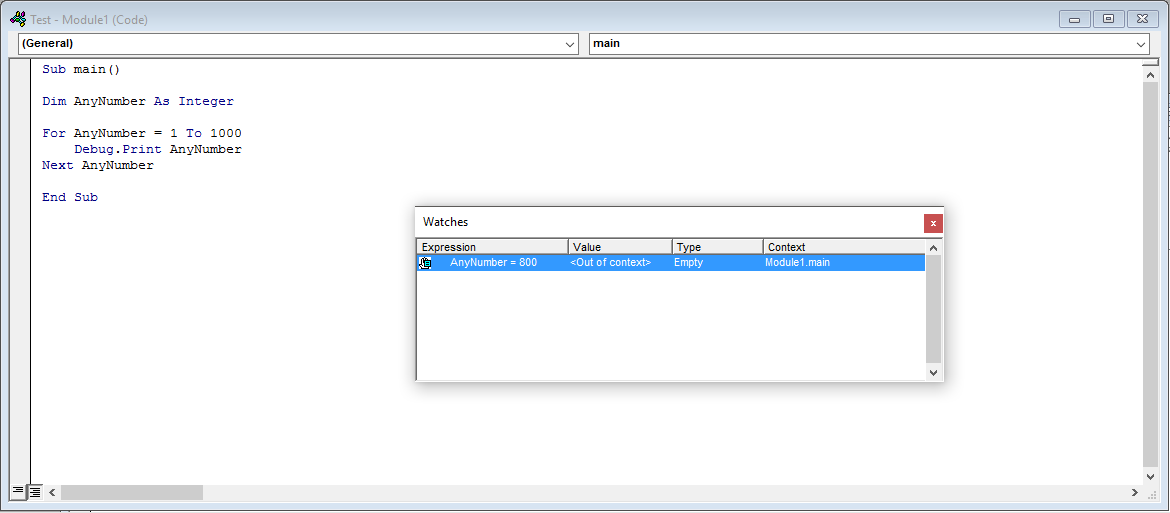
When you create a watch, VBE displays the Watches window shown in below figure.
This window displays the value of all watches that you’ve defined.
In this figure, when the value hit 800, which caused VBE to enter Break mode.
The best way to understand how this Watch business works is to use it and try various options.
Before long, you’ll probably wonder how you ever got along without it.
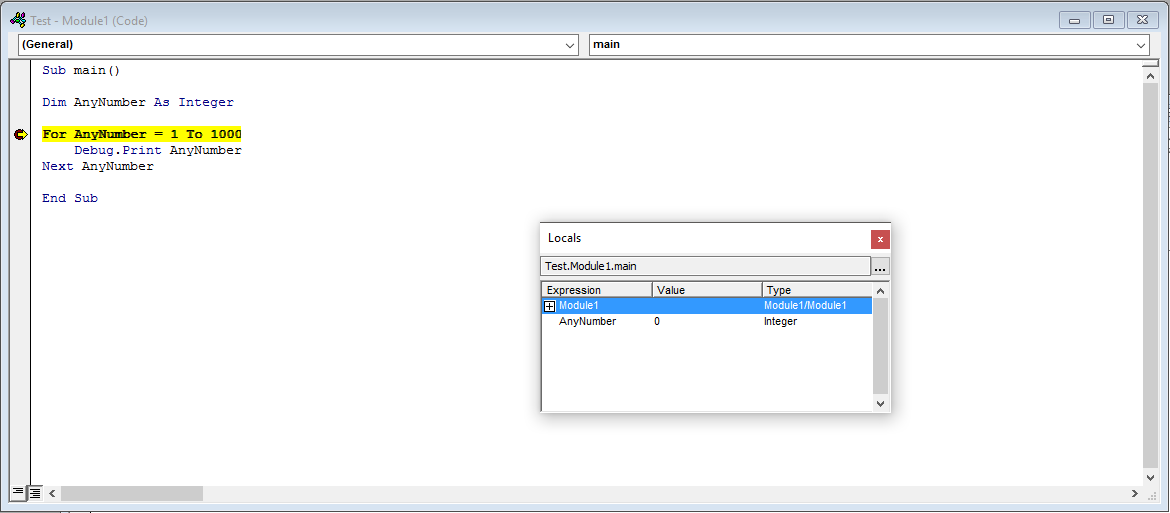
Using the Locals window
Another useful debugging aid is the Locals window.
You can show this window by choosing View -> Locals Window from the VBE’s menu.
When you are in Break mode, this window will show you a list of all variables that are local to the current procedure (see below figure).
The nice thing about this window is that you don’t have to add a load of watches manually if you want to look at the content of many variables.
The VBE has done all the hard workfor you.
Next post will be about VBA Bug Reduction Tips.